Information Content
The standard definition of information content of a term in a taxonomy, as proposed by Resnik in 1999 [1], is quantified as the negative log likelihood of a term. The concept expressed by the formula conveys the idea that as the frequency of a term increases, informativeness decreases. The probability of any concept in the taxonomy depends on the sum of the probabilities of the concepts it subsumes and, consequently, the nearer the term is to the root the more frequent and the less informative the concept is (see Fig. 1-ii). This is translated in the following formula:
)")
where IC is the Information Content and p(c) is the relative frequency of all of the descendants of the GO term c that are extracted from the GOA database:
 = {total occurrences of GO terms descendands of GO term c} / {total number of GO terms in the GOA database}")
Depending on the GOA database release used, the IC value changes as a consequence of the continuous enhancements and updates of both the protein annotations and the GO graph structure.
The information content range is from 0 (the root of the graph that is uninformative) to 1 (the most distant leaf of the graph carrying the best specific information).
We suggest leaving the default value unless one needs to discard the less informative GO annotations.
Internal Confidence (InC) and Total Score (TS)
Weighting the nodes
The scoring method is based on the estimation of some parameters which take into account the global cumulative weight distribution, which is the sum of the considered node weight plus the weights of its children, and local not cumulative weight distribution, which considers only the weight of the term under analysis. Each node is weighted according to the provided score (for BLAST and HMMER the logarithms of the e-values are considered). The corrected weights are reconstructed starting from the leaves of the graph up to the root following a non-redundant strategy (see Fig. 1-ii). During the exhaustive reconstruction of the multiple paths leading to the root of the graph, some parent nodes may be visited many times: non-redundant means that the score of a child node is added only once to the weights of the parent nodes during this process. The (cumulative) weight WGi of the node Gi is calculated as follows:

that is the absolute value of the sum of the child nodes' scores, and Si is the score of the node given in input. As a result of this additive strategy, only the most generic annotation terms, those near the root, show the highest scores at the expense of carrying less information. To tackle this behavior a different measure based on the Information Content (IC) was used to obtain an acceptable trade-off between detailed knowledge and statistical significance.
InC score
The InC is a normalized score whose values lie in the 0-1 interval; it has been specifically designed to assess the statistical significance of the retrieved hits.
In the cumulative score, the Internal Confidence (InC) is calculated for the node Gi as
where WGi is the sum of the weights of child nodes of Gi.
On the other hand, the non cumulative Internal Confidence for the node Gi (InCnci) is calculated as

where WncGi is the not cumulative weight of node Gi, that is the input score.
We suggest the user to rely on TS score (see below) and leave the default value for InC to 0. InC can help in discriminating GO hits whose Total Score (TS) is around 2.0. In this case, if InC is high and near 1.0, the GO hit can be considered a reasonable good prediction. If not, the annotation can be potentially uncertain.
Z-score and Group Score of the nodes
In order to eliminate the terms that are not functionally related to the initial query, the Z-score and the Group Score have been defined. The Z-score is calculated for node Gi as follows:

where W is the score of the root node divided by the total number of the nodes that compose the trimmed graph, WGi is the weight of node i and σ is the standard deviation assuming a Gaussian distribution of the graph (see Fig. 1-ii). The Group Score is calculated as the sum of the Internal Confidence of the nodes belonging to it. These two measures are used as a first filter for a preliminary skew of the false positive terms.
Total Score (TS)
For the GO terms which have passed the previous selections based on the Z-score and the Group score, the Total Score for each node Gi is calculated according to the following formula

where ICi is the Information Content, WncGi is the value given in input to Argot2.5 for then node Gi and GSnci is the non-cumulative Group Score, which in turn is calculated as the sum of the non-cumulative Internal Confidence of the nodes belonging to the group; the TS score is not normalized as it starts from 0 and has no upper bound.
We suggest the user a TS score ≥ 200.0 to have a “good” prediction based on our benchmark test conditions. InC (see above) can be evaluated if TS is low.
Grouping by means of semantic similarity
Once the “final trimmed GO graph” has been obtained, the remaining GO nodes are grouped according to their semantic similarity (see Fig. 1-iii,1-iv). This approach has already been applied in natural language processing and taxonomies providing a manageable metric with which to link different terms carrying similar information. There are many different methods for calculating the shared information between two terms, but we obtained the best results using Lin’s formula [2]. This formula has the advantage of reporting a normalized value between 0 and 1 and has already been proven to outperform other algorithms even though it may be affected by shallow annotations. Lin’s formula is defined as:
 = {2 cdot sim_{res}(c_1, c_2)} / {IC(c_1) + IC(c_2)}")
where
 = max_{c in S(c_1, c_2)} IC(c)")
S(c1, c2) are the common subsumers of c1 and c2 terms and simres(c1, c2) is the one with the highest Information Content IC. In other words, the algorithm finds the nearest parent node that is shared by the two terms whose semantic distance is to be calculated.
This quantifies the extent to which two concepts are related according to their position, which is highly dependent on the graph connections and density. This measure is much more effective and meaningful than absolute edge distance as it accounts for the real relationships among concepts. For example, the two GO nodes GO:0043734 “pigmentation” and GO:0016032 “viral reproduction” have the root node GO:0008150 “biological process” as parent. These GO terms may be erroneously considered neighbors as their edge distance is 2 but their meaning is completely different. This difference appears immediately evident from a semantic similarity perspective, as the IC of the parent node is 0, being the root of the ontology, and consequently the semantic similarity is 0, as expected. The same edge distance exists between two similar GO terms: GO:0004602 “glutathione peroxidase activity”, which occurs 69 times over 168,919 gene products (as of March 2008 GO release), and GO:0047066 “phospholipid-hydroperoxide glutathione peroxidase activity”, which occurs 5 times. They both descend from a common ancestor GO:0004601 “peroxidase activity” with 409 occurrences, subsuming all the occurrences of its child nodes. In this case, semantic similarity calculated with Lin’s formula is 0.66 as follows:
 = -log({69} / {168,919}) = 3.39")
 = -log({5} / {168,919}) = 4.53")
, IC(GO:0004602))")
 = -log({409} / {168,919}) = 2.62")
, IC(GO:0047066))")
, IC(GO:0004602))} /{IC(GO:0004602) + IC(GO:0047066)}")

This reveals that the GO terms are strict neighbors. Comparing the two examples it is clear that edge distance is unsuitable and insufficiently discriminative for finding related concepts.
Semantic similarity is used to group GO terms that belong to the “final trimmed GO graph” containing the most probable starting paths and allows the number of similar GO terms in highly populated regions of the graph to be further reduced (see Fig. 1-iii,-iv). The algorithm attempts to group recursively the GO terms that have been retrieved by the BLAST hits R and belong to the “final trimmed GO graph” with strict semantic similarity of over 0.7. Those GO nodes that are part of the different paths leading to the root of the graph but that have not been found in the annotation of the BLAST hits, are not considered in this calculation. A matrix distance is computed by performing an all vs. all comparison of the IC scores of the GO terms retrieved from R using the Lin’s formula and if two terms satisfy the cut-off they are merged into the same group (see Fig. 1-iii):

 >= 0.7 right g_j in G_i")
gGi is the initiator node of the group Gi. The initiator gj, is another GO node and n is the total number of GO terms extracted from R and present in the “final trimmed GO graph”. At the beginning of the clustering process any GO term is a potential initiator node and is considered the founder of a forming cluster: the GO terms sharing a semantic similarity of 0.7 are added. After the first clustering step a second and less stringent threshold of 0.6 is applied to further merge acquired groups that have at least one GO term in common. Only the initiator nodes or founders gGi are involved in this process (see Fig. 1-iv). The grouping strategy has the effect of gathering together semantically similar GO terms thus actually reducing the search space as only one or few representatives per group are chosen according to their scores, described in the next section, and IC.
1)Resnik, P. (1999) Semantic similarity in a taxonomy: An information-based measure and its application to problems of ambiguity in natural language. Journal of Artificial Intelligence Research, 11, 95-130.
2)Lin D (1998) An Information-Theoretic Definition of Similarity. Proceedings of the Fifteenth International Conference on Machine Learning (ICML'98): Morgan Kaufmann Publishers Inc. pp. 296-304
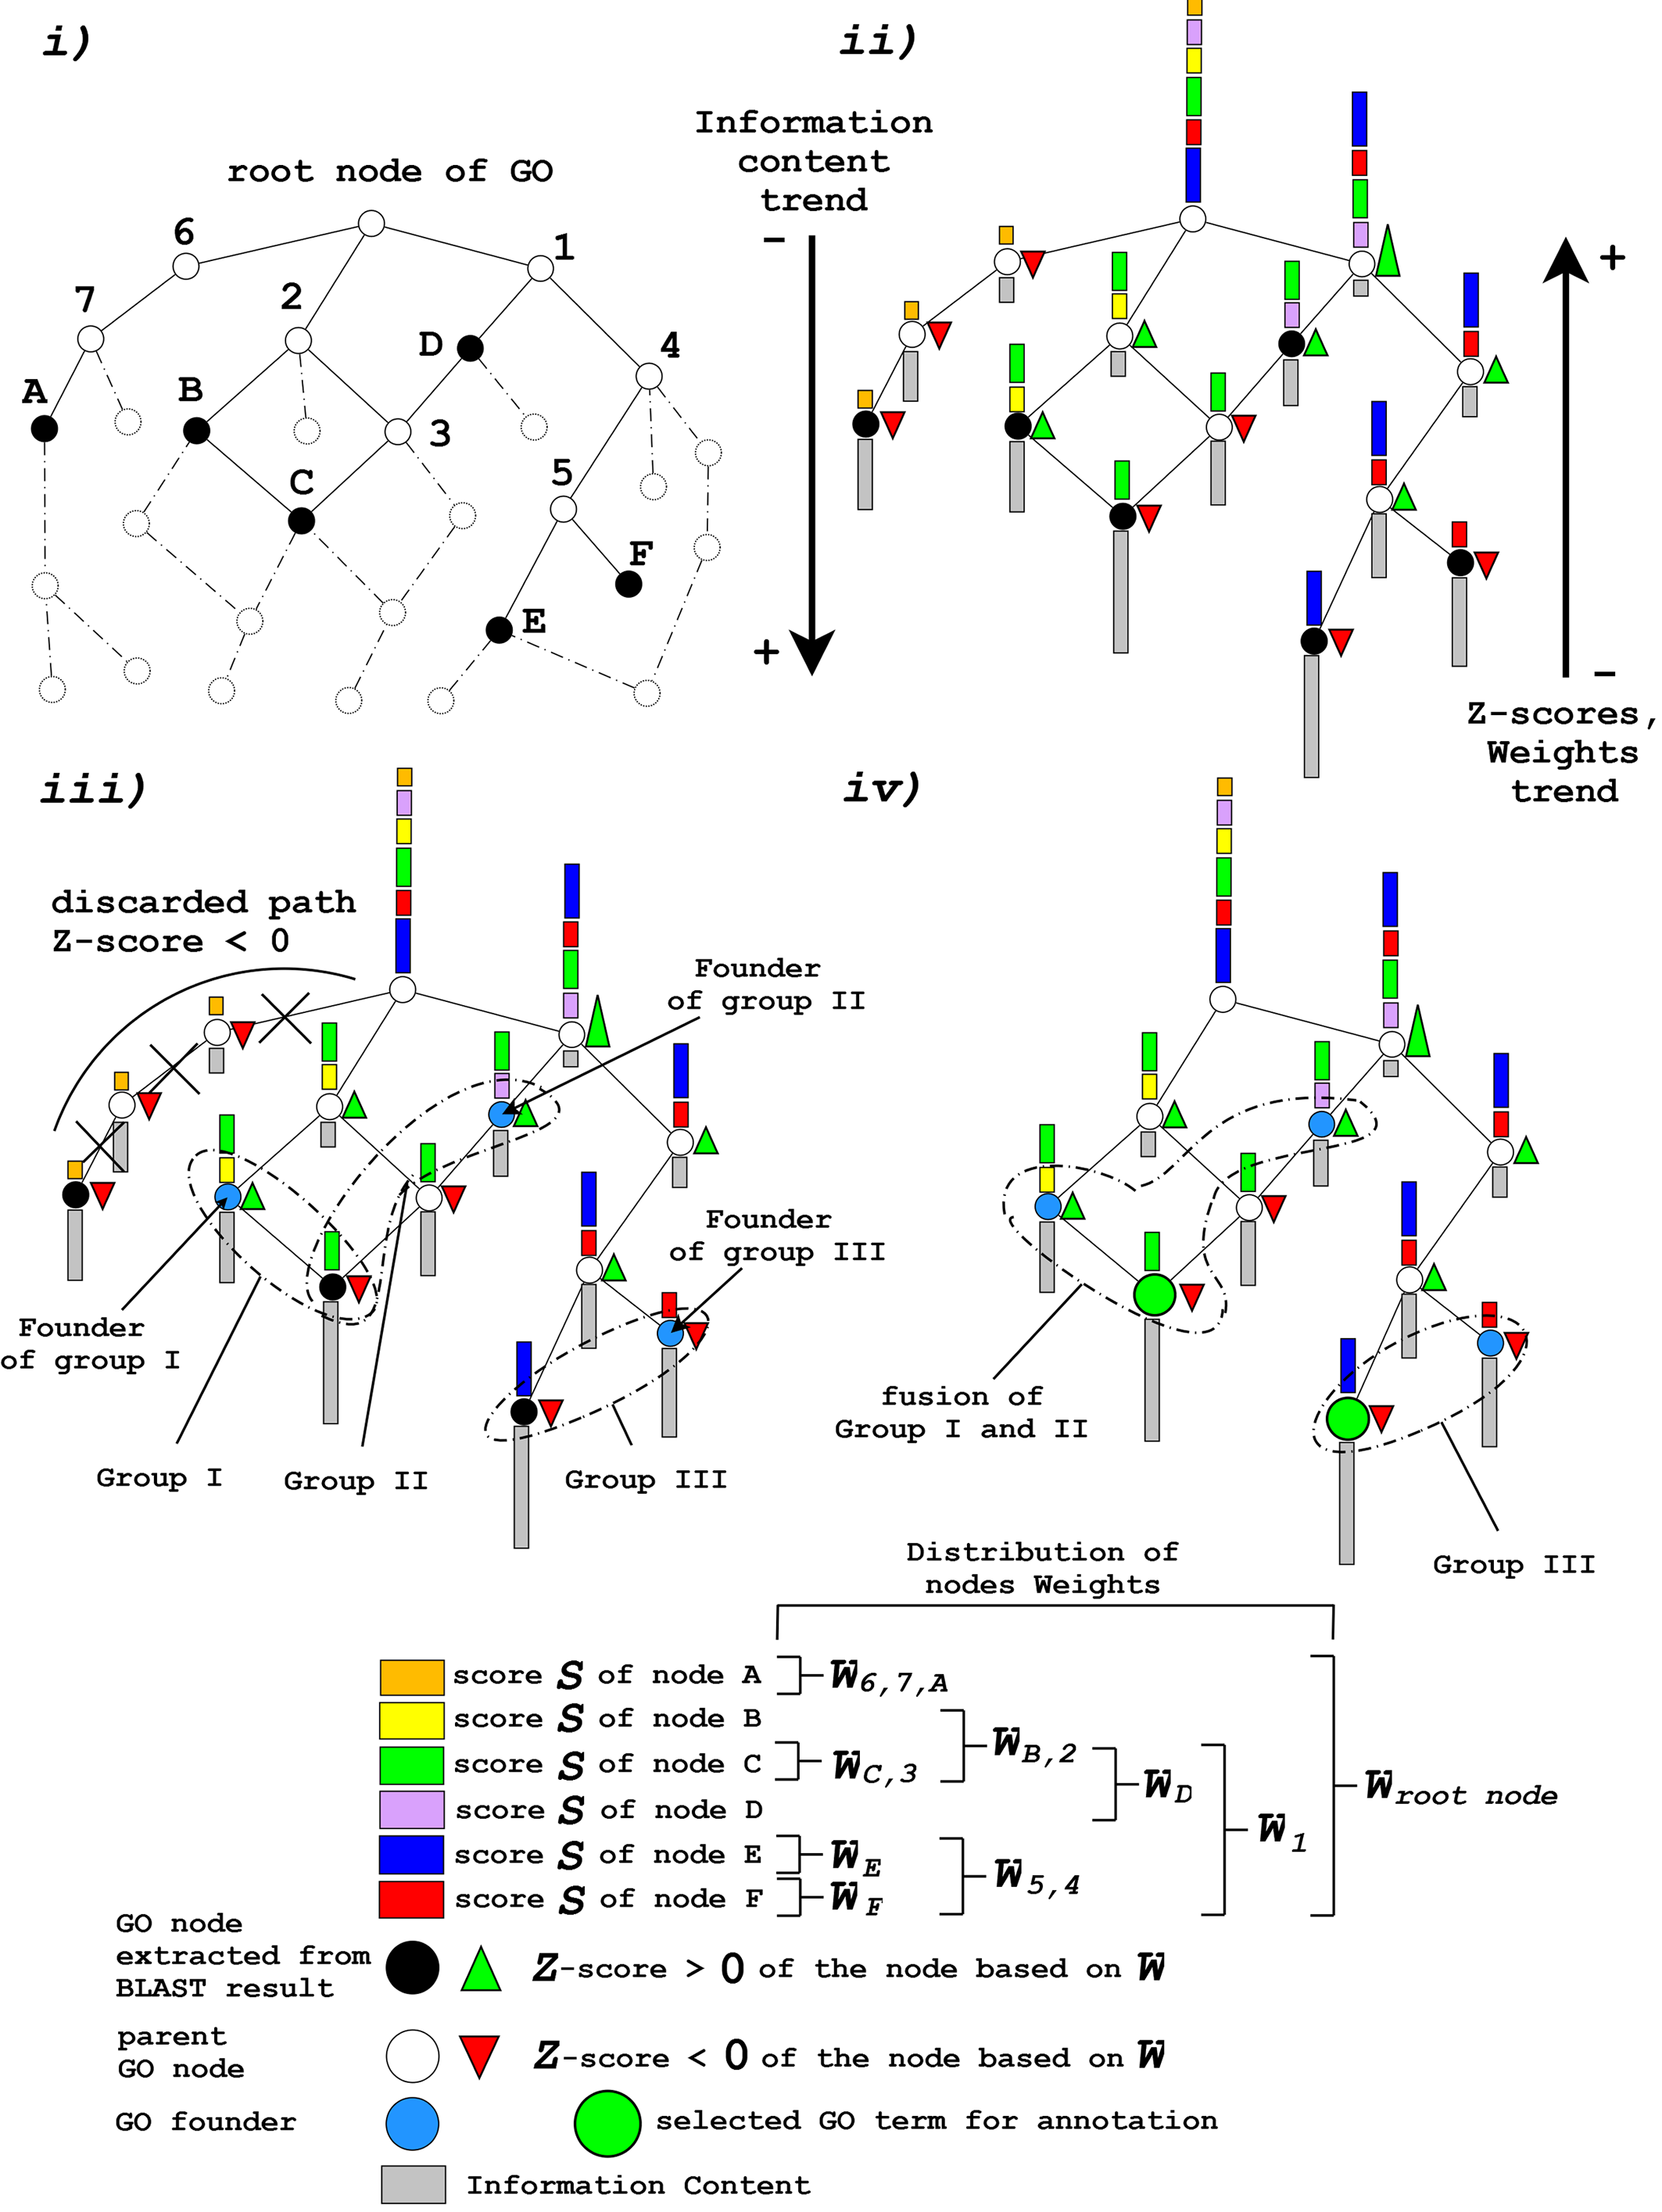
Figure 1: Schematic representation of the Argot2.5 algorithm. The first step i) “Trimming the GO graph” involves the trimming of the GO graph to obtain a slim containing only the putative GO hits extracted in order to annotate the query protein (black circles). In the second step ii) “Weighting the GO nodes” and “GO Information content”, the algorithm calculates the Information Content (IC) (gray bars) of the nodes in the graph and their cumulative weights (colored bars) derived from the BLAST scores. In the third step iii) “Grouping by means of semantic similarity” and “Choosing the most probable paths in the “initial trimmed GO graph”, GO nodes are clustered into groups having a given semantic similarity using the Lin formula; GO terms which populate isolated branches of the graph are discarded on the basis of their Z-score (red and green triangles) applied to the node weights. In the last step iv) “Grouping by means of semantic similarity” Argot2.5 tries to merge similar clusters on the basis of semantic distance calculated among the groups’ founders (azure circles) using less stringent cut-offs. GO terms with the highest IC (green big circles) are chosen as representatives of the clusters obtained.